My First Data Analysis Project: Analyzing Tech Stock Performance
- Sofia Herrmann

- Dec 3, 2025
- 1 min read
Updated: Jan 7
As an aspiring data analyst, I recently completed my first real-world project: analyzing the performance of 5 major tech stocks ,
🎯 THE CHALLENGE As tech stocks dominated headlines in 2024, I wanted to answer:
"Which tech giants actually deliver the best risk-adjusted returns?" Beyond just looking at price gains, I needed to understand volatility, correlation, and true investment value.
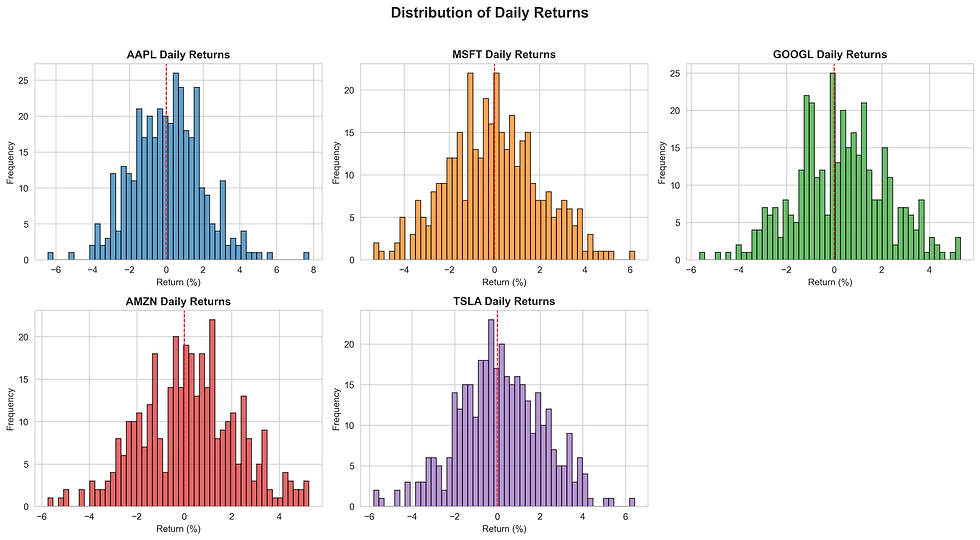
💡 THE APPROACH I analyzed one year of daily stock data for AAPL, MSFT, GOOGL, AMZN, and TSLA, calculating: - Sharpe ratios (risk-adjusted returns) - Maximum drawdown (worst-case scenarios) - Correlation matrices (diversification opportunities) - Volatility patterns (investment risk)
🔍 THE DISCOVERY The results surprised me. GOOGL, often overshadowed by Tesla's hype, emerged as the clear winner with a 174% return AND a stellar 2.43 Sharpe ratio. Meanwhile, TSLA's high volatility (2.0% daily) meant investors were riding a rollercoaster for those returns. Even more interesting: I found that AAPL and MSFT moved together (0.65 correlation), meaning they don't provide good diversification if held together.
💼 WHY IT MATTERS For investors: Price gains alone don't tell the story. GOOGL delivered superior returns with less heart-pounding volatility. For portfolio managers: My correlation analysis shows which stocks actually diversify risk versus just adding similar exposure. This analysis proves that data-driven investment decisions beat gut feelings and media hype.
📈 TECHNICAL SKILLS: Python, Pandas, Matplotlib, Seaborn, Financial Metrics


Comments